
Examining Vaccine Effectiveness
A lot of us hoped that the COVID vaccines would free us from concerns about COVID infection. As I personally read over the Pfizer report at the end of 2020, my heart jumped when I saw a chart of infection rates flatlining 12 days post-shot for the vaccinated cohort while infections marched on in the control group. But as we’ve gone through Delta and Omicron, a good bit of this shininess has worn off of the vaccines as large numbers of vaccinated people (myself included) become infected with these COVID variants. If that was the end of it, I’d agree with the skeptics that the vaccines are largely a failure. But taking a closer look at the data, a very different story starts to emerge.
December 2021 Data
Towards the end of November in Rhode Island as people headed indoors, Delta continued its spread and Omicron started to quickly take hold (really taking over through December). This led to a precipitous rise in cases, hospitalizations, and (sadly) deaths in December 2021. That month, there were 146 COVID-19 deaths in RI. The RI Department of Health reports COVID deaths, along with the monthly breakdown of deaths by age and monthly totals for breakthrough deaths (COVID deaths of people who have received two vaccine doses). They also report weekly vaccination data - including vax rates - broken down by age, which opens up the ability to perform a base rate analysis of COVID deaths for a given month.
Of the 146 COVID deaths in December 2021, 56 of those were reported to be breakthrough deaths (deaths of people who have had at least two vaccine doses), leaving 90 that I classified as “unvaccinated”.
Methodology
The first step of my analysis involved calculating the base rates for each age group that deaths were reported in. If the vaccines were to have no bearing on whether someone dies of COVID, then you would expect the breakdown of deaths to match the vaccine prevalence (i.e., if 100 people were to die of COVID in an age group that was 70% vaccinated, and vaccines have no relationship to COVID deaths, then you would expect for about 70 of the deaths to be vaccinated people and 30 to be unvaccinated).
For each age group, I figured the ratio of COVID deaths for that age range that one would expect under this “no effect” assumption given the vaccine rate reported for that age group. It’s important to note here that the vaccination rates reported by RIDoH appear to be unrealistically high. I suspect this is in part because of inaccurate counting and individual attribution, and also because RIDoH uses population distribution data from 2018 for their rate calculations. For instance, RIDoH reports vaccination rates for people age 70-79 which would mean 99% of this group is vaccinated. While I suspect in our state the rate is very high for that age group (>90% doesn’t seem unreasonable), 99% seems like too much. Therefore, I introduced a factor I could use to proportionally scale back the reported vaccination rates and varied that factor to see how much the calculated values changed for various realistic vax rates. I performed two sets of calculations, one with rates scaled back 5%, and another with rates scaled back 15%, to figure high and low estimates and get an idea of how sensitive my final calculations were to this quantity that includes some uncertainty.
Based on this base-rate analysis, if vaccines had no relation to COVID deaths, one would expect unvaccinated people to make up between 24 and 37 of the 146 deaths, and vaccinated people to make up between 109 and 122. However, only 56 of the 146 deaths were vaccinated individuals, and the other 90 were unvaccinated. COVID deaths skew strongly toward the unvaccinated, with unvaccinated people making up 2.5-3.8x more COVID deaths than you’d expect if vaccines had no effect. On the other hand, vaccinated people made up about half as many COVID deaths as you’d expect if the vaccines had no effect.
The impact of the vaccines
These calculations also let us ask some additional questions of the data.
- How many of the unvaccinated people would have died if they experienced COVID deaths at the same rate as the vaccinated cohort (preventable deaths)?
- How many vaccinated people would have died if they experienced COVID deaths at the same rate as the unvaccinated cohort (prevented deaths)?
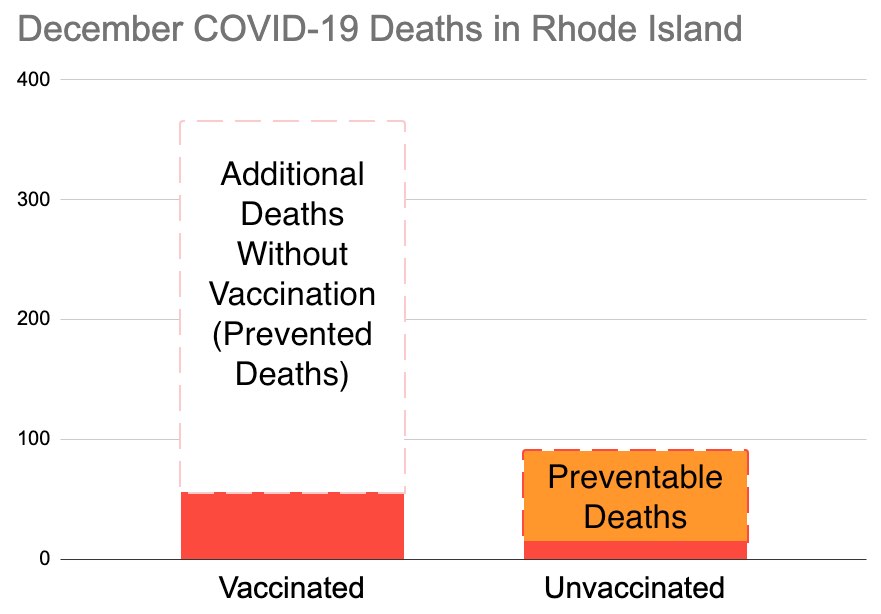
Based on the range of vaccination rates considered, the data suggests 71-79 of the 90 deaths among the unvaccinated would have been prevented if that group had experienced deaths at the same rate as the vaccinated group. In other words, it seems like about half of the COVID deaths that occurred in Rhode Island in December 2021 would have been prevented by universal vaccination.
The data also shows that if the vaccinated groups had experienced COVID deaths at the same rate as the unvaccinated group, 212-405 more COVID deaths would have occurred. In other words, without vaccines, the number of COVID deaths in Rhode Island in December could have been in the 350-550 range. (this figure is more sensitive to uncertainty in base vax rates).
Higher values of the base vax rate tend to predict more avoidable deaths and more prevented deaths. Here are my calculations, if you want to have a look.
Also, for a good discussion on why vaccines seem to drive down COVID deaths even when their ability to prevent infection seems to wane over a relatively short timeframe, I highly recommend reading the article that I find has made made the most sense of the pandemic of anything I’ve read: Novelty Means Severity: The Key To the Pandemic.
Feb 8 Update - January 2022 Data
The February 8 data update from RIDoH included the monthly data regarding age distribution in COVID deaths and breakthroughs to perform this same sort of analysis for January.
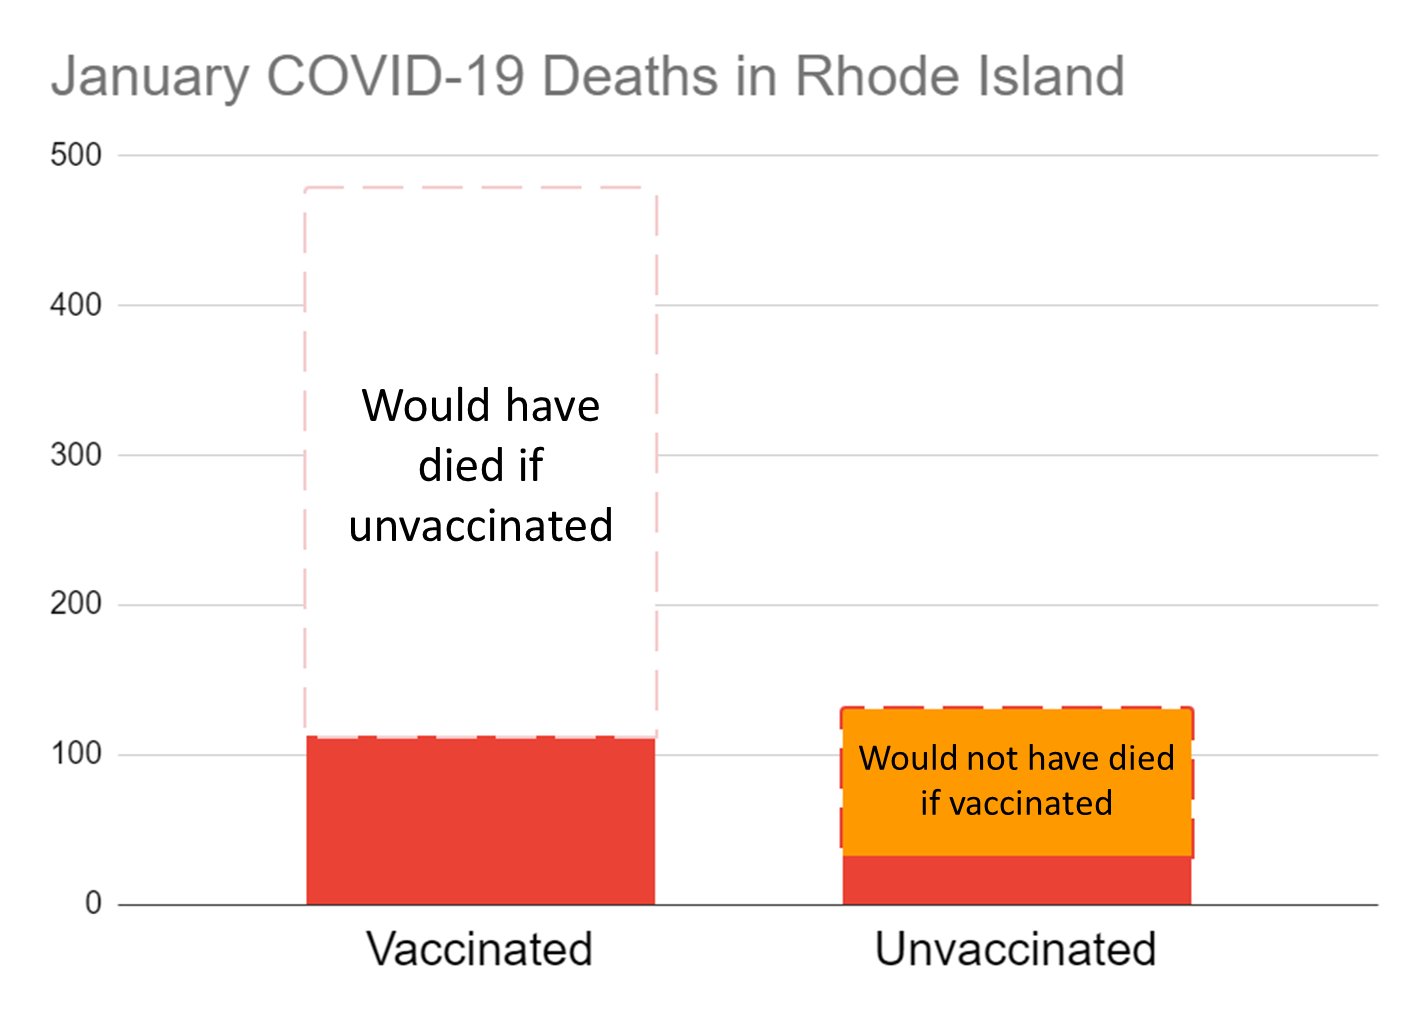
- In January 2022 there were 243 COVID deaths, 113 of which were breakthroughs.
- If the unvaccinated cohort had died at same rate as the vaccinated, there would have been 138-154 deaths (about 100 fewer).
- If the vaccinated cohort had died at same rate as the unvaccinated, there would have been 490-726 deaths (about 250-475 more).
All of this is to say, if Omicron had hit before there were vaccines available, January would probably have seen the highest number of COVID deaths of any month in Rhode Island, especially considering that this analysis doesn’t take into account the impact that vaccinations have on reducing hospitalization and transmission along with the compounding effect that even higher case counts and dramatically higher hospitalization numbers (in hospitals that for several weeks were stretched extremely thin) would have had on the number of COVID deaths. As I look at the data, it seems the “mildness” of omicron comes as much from the widespread protection provided by vaccines as it does from any intrinsic lower virulence of the variant itself.
Also - I was speaking with a doctor friend recently who is well-connected with RIDoH, and she suggested that perhaps the vaccination rates reported by RIDoH for the elderly may not be as severe an over-estimate as I’m thinking. I still think that 99% is a little high for 70-79, but my “high” estimate for this group is under 95%. If it is higher than that, then numbers skew even more favorably towards the vaccine reducing COVID deaths.