April Eclipse Introduction
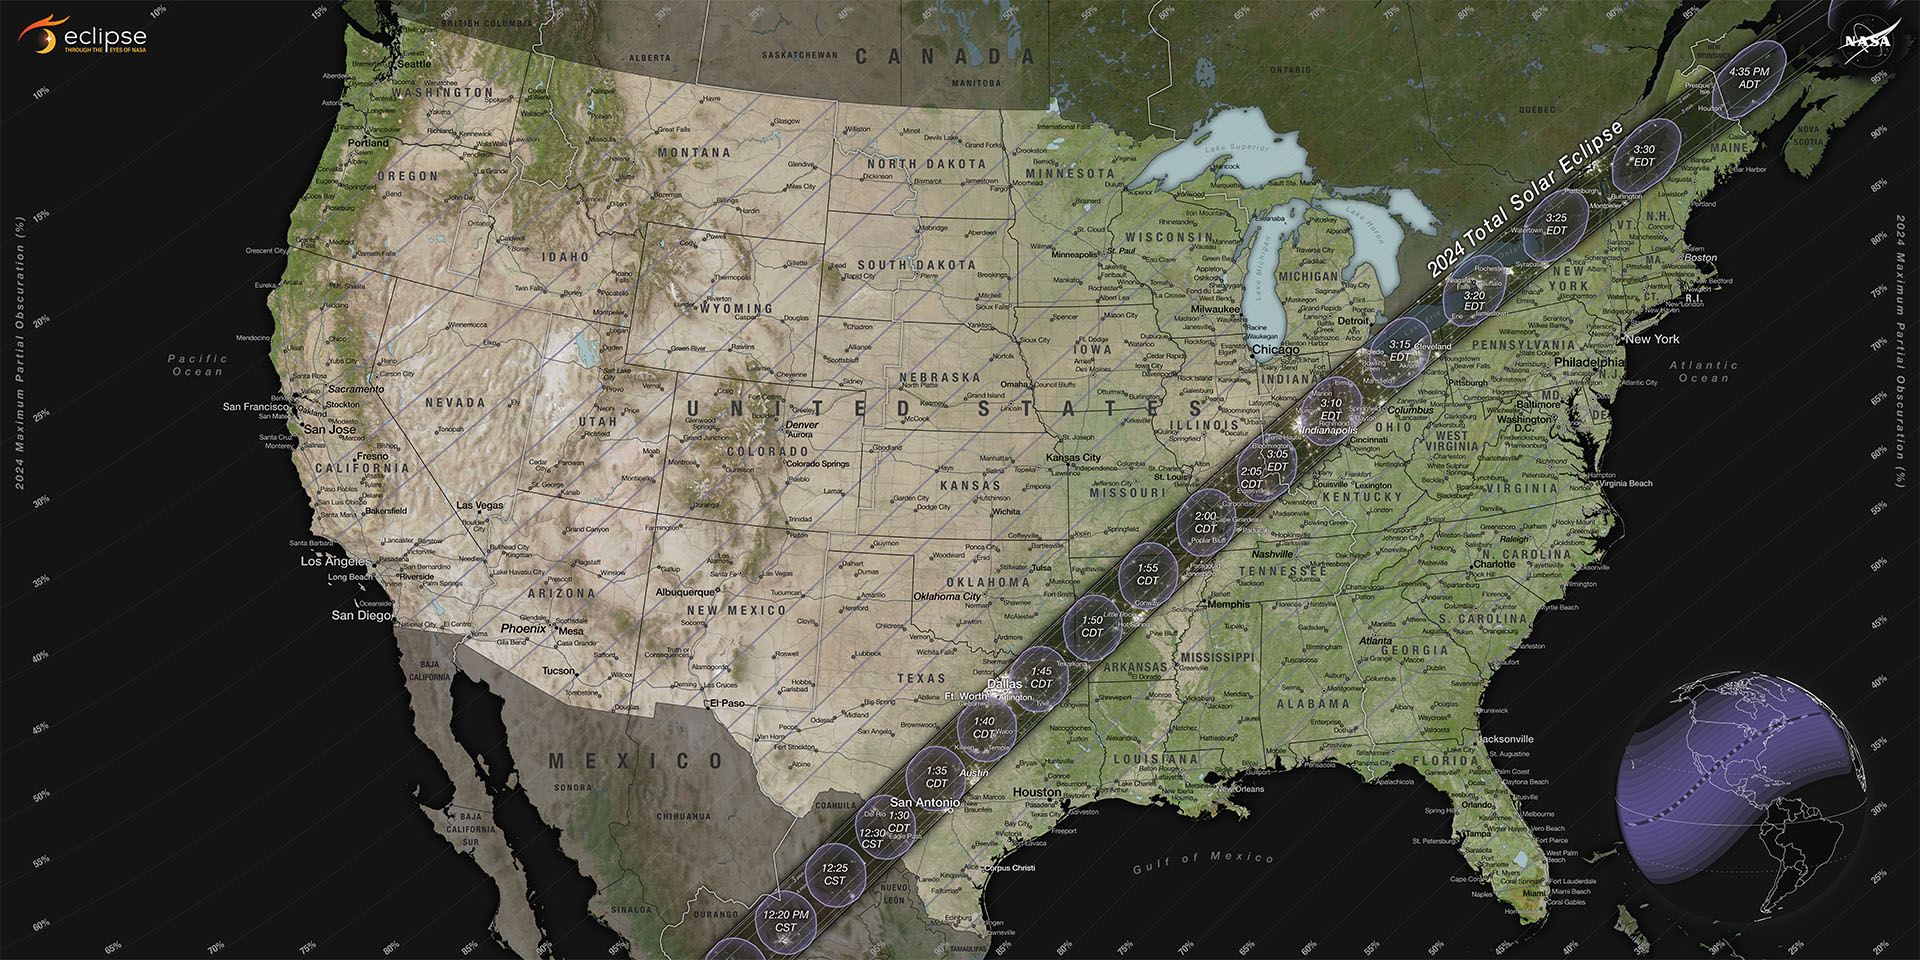
The exciting thing about the April 8 eclipse is that it’s passing through and near a lot of populated places in the United States. It’s a lot like the eclipse in 2017 (where I captured the data for the image above), except it passes through a different array of cities and totality will last a bit longer than the one in 2017. Here’s a map from NASA showing the path for the April 2024 eclipse.
 NASA Map
What’s the Big Deal?
Note the dark-shaded path of totality. This is the path that the moon’s umbra, or complete shadow, will trace over the earth. These are the regions that will experience a total eclipse, and this is the path that you want to be in. Let me state very clearly - There is a massive difference between a partial eclipse and a total eclipse. If you are near the path of totality but not in the path of totality, you will only experience a partial eclipse.
If a partial eclipse is like watching your kid play Tecmo baseball on Nintendo, a total eclipse is like playing in game 7 of the World Series. They’re completely different experiences.
In a partial eclipse, when the moon partly blocks the sun, you…
- cannot view the sun’s corona
- might notice things getting a bit dimmer
- can do things like use pinhole projectors and eclipse glasses to observe the partially-blocked sun
- will need a solar filter to safely photograph the event
- can see weird shadows where the sun creates dappled light like shining through leaves
- likely wouldn’t know an eclipse was happening unless you were trying to observe it
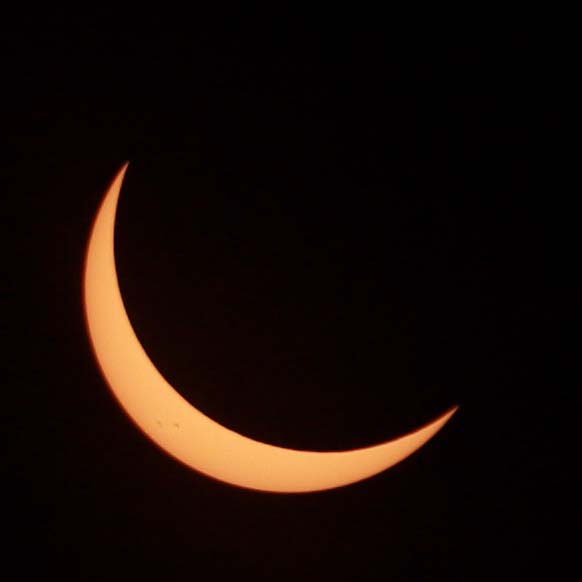 Partial phase of the 2017 eclipse, photo through a solar filter
In a total eclipse, where the moon completely blocks the sun, you…
- can see the beauty of the sun’s corona
- will see the sky get dark
- can view totality with your naked eye
- can photograph totality without any solar filters (take them off during totality)
- can see stars in sky (note Regulus, the star in the eclipse photo from 2017)
- will experience nature freaking out around you as it thinks that night has suddenly come
- will probably be unable to refrain from exclaiming aloud how amazing a sight it is you’re beholding
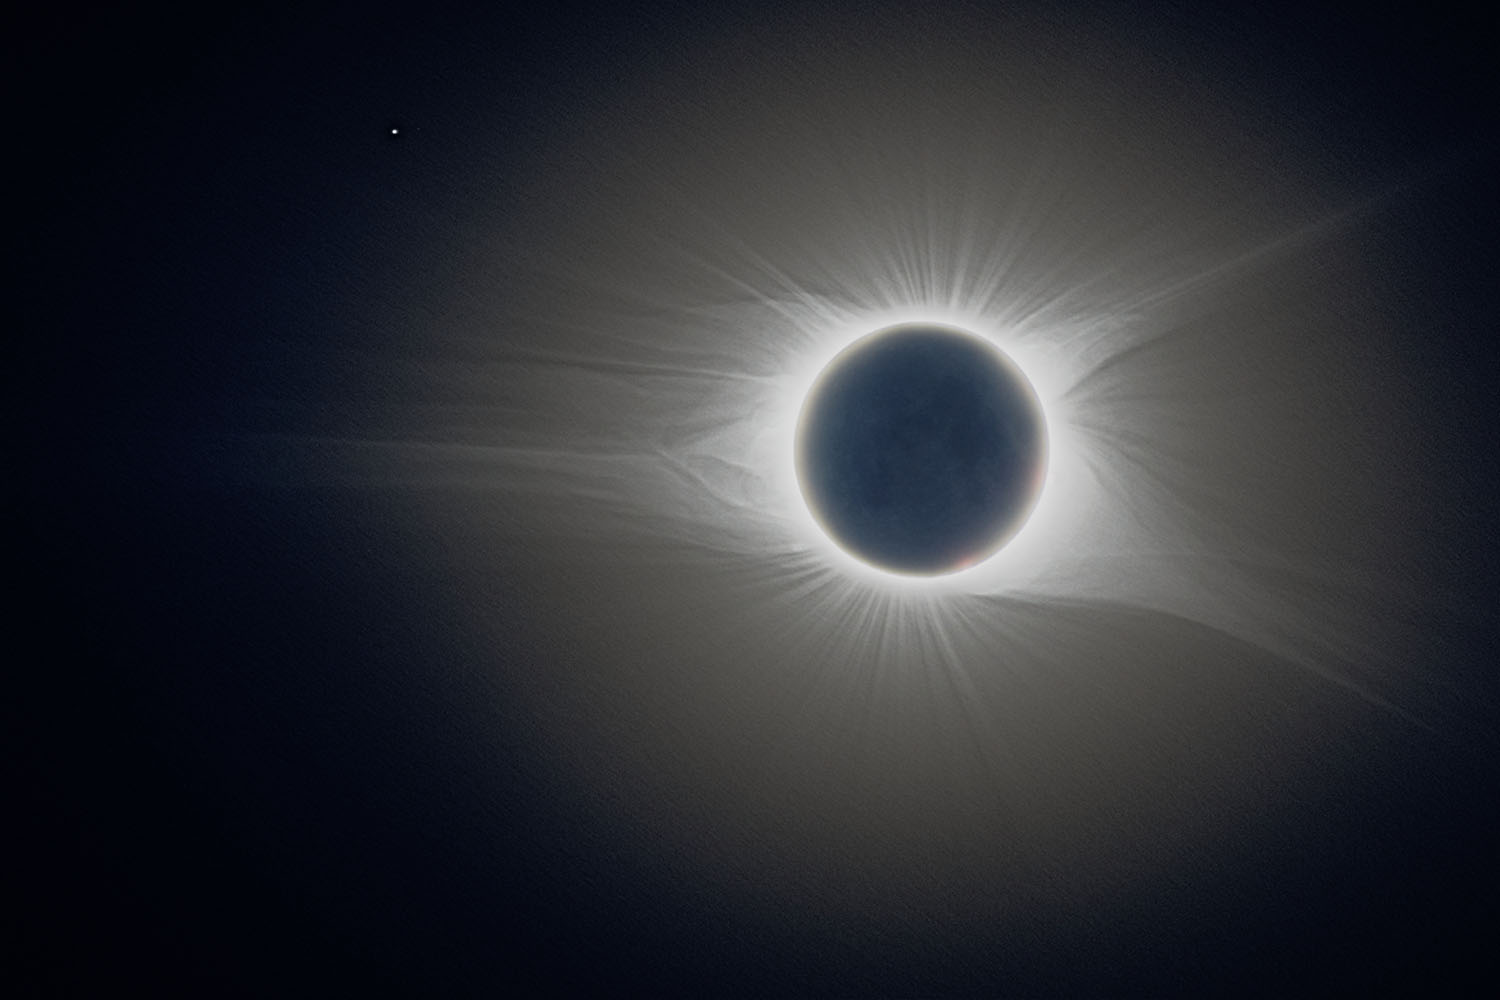 Composite of the August 21, 2017 eclipse totality showing the corona and earthshine on the moon, no filter needed
Just to be perfectly clear about what we’re talking about - a total solar eclipse is the most incredible natural spectacle I have ever beheld. 2nd place isn’t even close. So, hopefully I’ve convinced you to do what you can to get into the path of totality, preferably in a spot where the sky is expected to be clear.
Where in the Path?
So where should you try to get to? Not everywhere in the ~60 mile wide path will have the same experience.
Close to the Centerline
Get well into the path rather than right on the edge. The closer you are to the centerline, the longer totality will last, and the darker the sky will get. The National Solar Observatory has a very handy website that includes a map that allows you to click on a location and see exactly when totality starts and ends, and how long it will last. On the centerline, totality will range from just over 4 minutes and 20 seconds in most of Texas to around 3 minutes and 30 seconds once it reaches Maine. It’s probably worth a little travel to get close to the centerline, especially if you’re right on the edge of it.
Weather
This eclipse is happening in April, which means weather is likely to have an impact. An eclipse isn’t particularly interesting if it’s obscured by clouds. You can’t control the weather, but you can plan around it. There are two phases to this - climatological and short-range forecasting.
Climate and Location
We know where the eclipse is going to be, and we know what the historical weather has been along those routes. Average climate data can tell us far in advance where the dice are weighted in our favor. For instance, in Dallas, it’s historically clear a little over 40% of the time in April, mostly clear or clear at least 50% of the time. Figure based on this that in Dallas, you’re probably looking at a little better than 50% chance that the weather will allow you to view the eclipse.
On the other hand, in Millinocket, Maine in April it’s clear just 20% of days, clear or mostly clear just 30% of days. So a viewer in Maine is substantially more likely to be dealing with clouds than one in Dallas, and have something closer to a 1-in-3 chance of having a clear view of the eclipse day-of.
Obviously, this isn’t a slam dunk. It could be cloudy in Dallas and clear as a bell in Maine on April 8 - that’s just the nature of weather and statistics. So forecasting becomes important.
Forecasts
A few days ahead of the eclipse, forecasting models should have some idea of where clouds are likely to develop during the eclipse. Check out the NWS Graphical Forecast to see sky cover predictions a few days out. Hopefully, you have a place that’s totally in the clear day of, but if you need to check short-range predictions, use a tool like the High Resolution Rapid Refresh (HRRR) forecasts to see what clouds are expected to be 5-15 hours in advance.
If you’re wanting to give yourself the best possible chance of seeing the eclipse, have plans to fly to one of a few different locations, pick one a few days ahead based on the forecast, and then try to have some flexibility to drive a little ways day-of. Obviously not everyone has that sort of flexibility, but this is the best way to make sure you’re not looking at very dark clouds overhead on April 8.
Safety (or “How to Not Go Blind”)
The first note for people who are in the path of totality - take off your solar glasses and solar filters during totality (and only during totality - put them back on as totality ends). If you wear solar glasses during totality, you’ll miss what’s possibly the most incredible sight you’ve ever seen.
Direct Observation
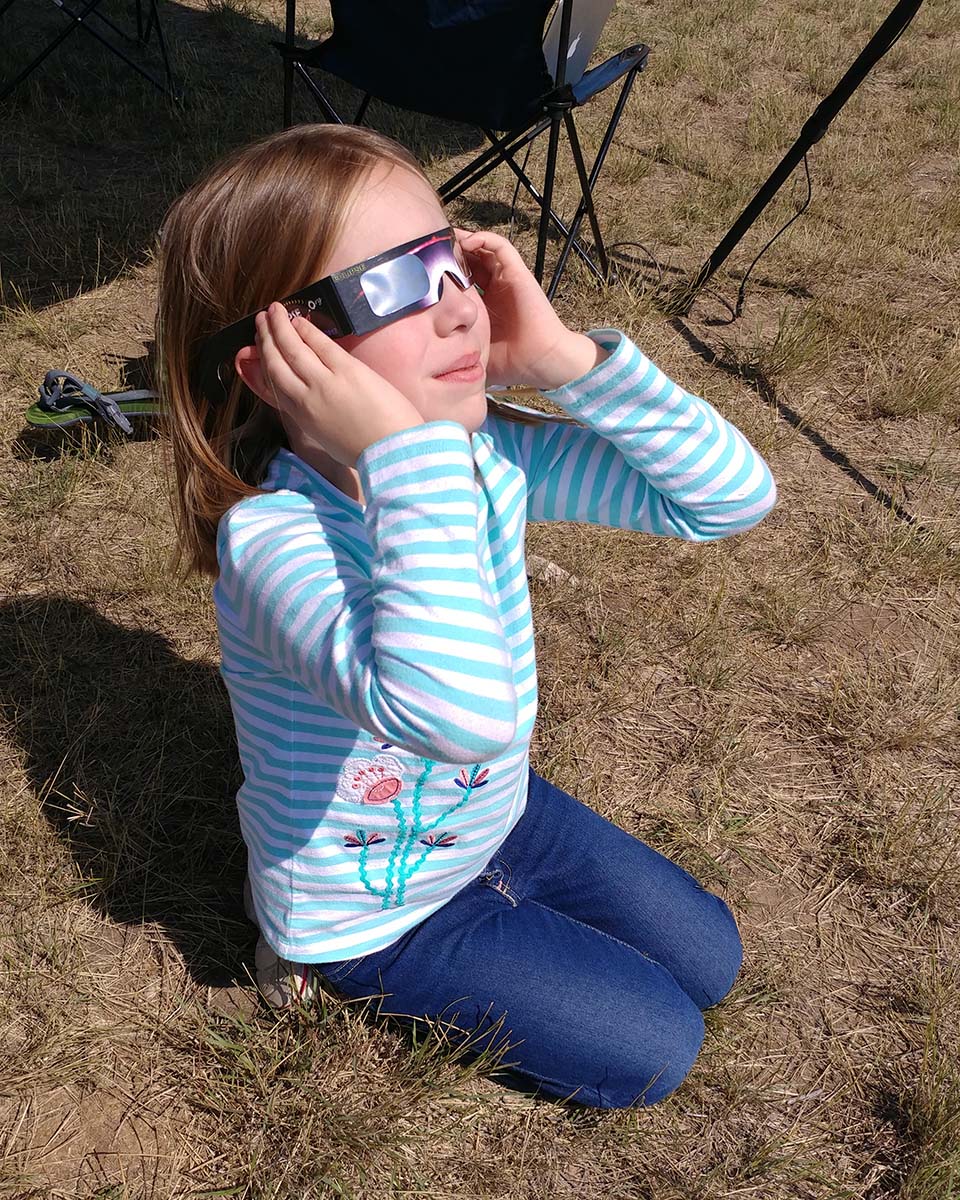 My oldest sporting a pair of reputable cardboard eclipse glasses in 2017
The only safe way to directly observe a partial eclipse (or view a total eclipse during the partial phases - before and after totality) is through appropriate solar filter material. Failure to do this can result in eye damage. Make sure you get filters/viewers/glasses from a reputable source. Thousand Oaks Optical would be one example - that’s where I’m getting solar filters for viewing and for photography. Look for viewers that comply with the ISO 12312-2 standard. Regular sunglasses, even especially dark ones are not adequate for direct solar viewing. Use these solar filters until the entire photosphere (the bright part of the sun’s surface) is completely obscured by the moon.
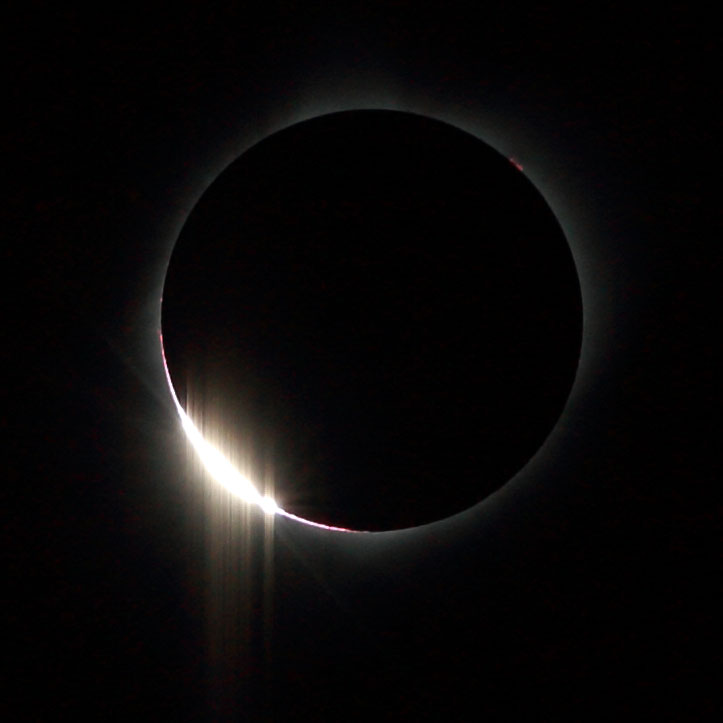 Bailey’s Beads - get ready to take those glasses off
If you’re in the path of totality, once the last little bit of the photosphere has passed behind the moon (you’re past the “Bailey’s Beads” phase shown above), that is when you should take off your glasses. At this point, you’ll be able to see the sun’s corona.
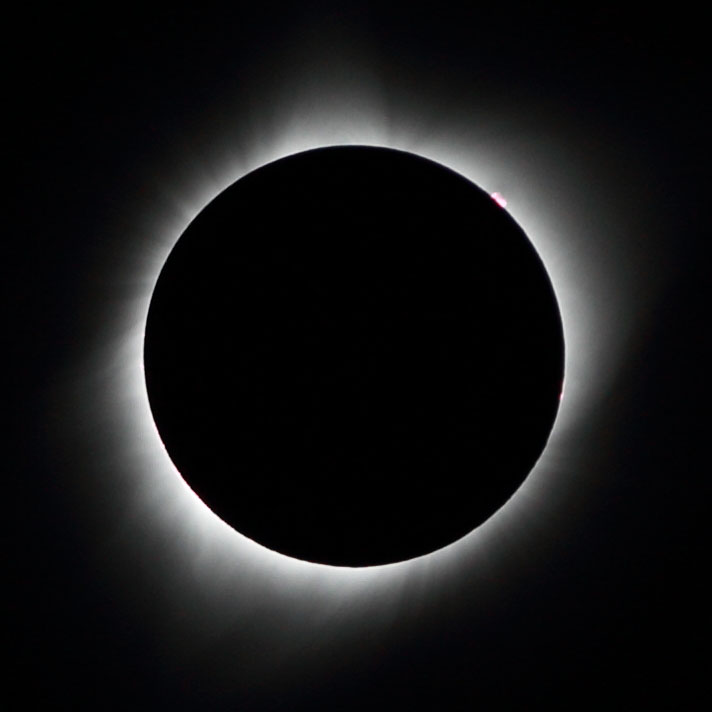 The inner corona and prominences during totality in the 2017 eclipse
Keep an eye on the time - put your glasses back on immediately as the photosphere comes back into view on the other side of the moon. There are some helpful apps out there, some of which will call out instructions about when to take your glasses off and put your glasses on again based on your location.
Indirect Observation
If you don’t have access to solar filters, there are any number of techniques to indirectly view the partially eclipsed sun. Again, don’t bother with these during totality - just look at the corona directly during that phase.
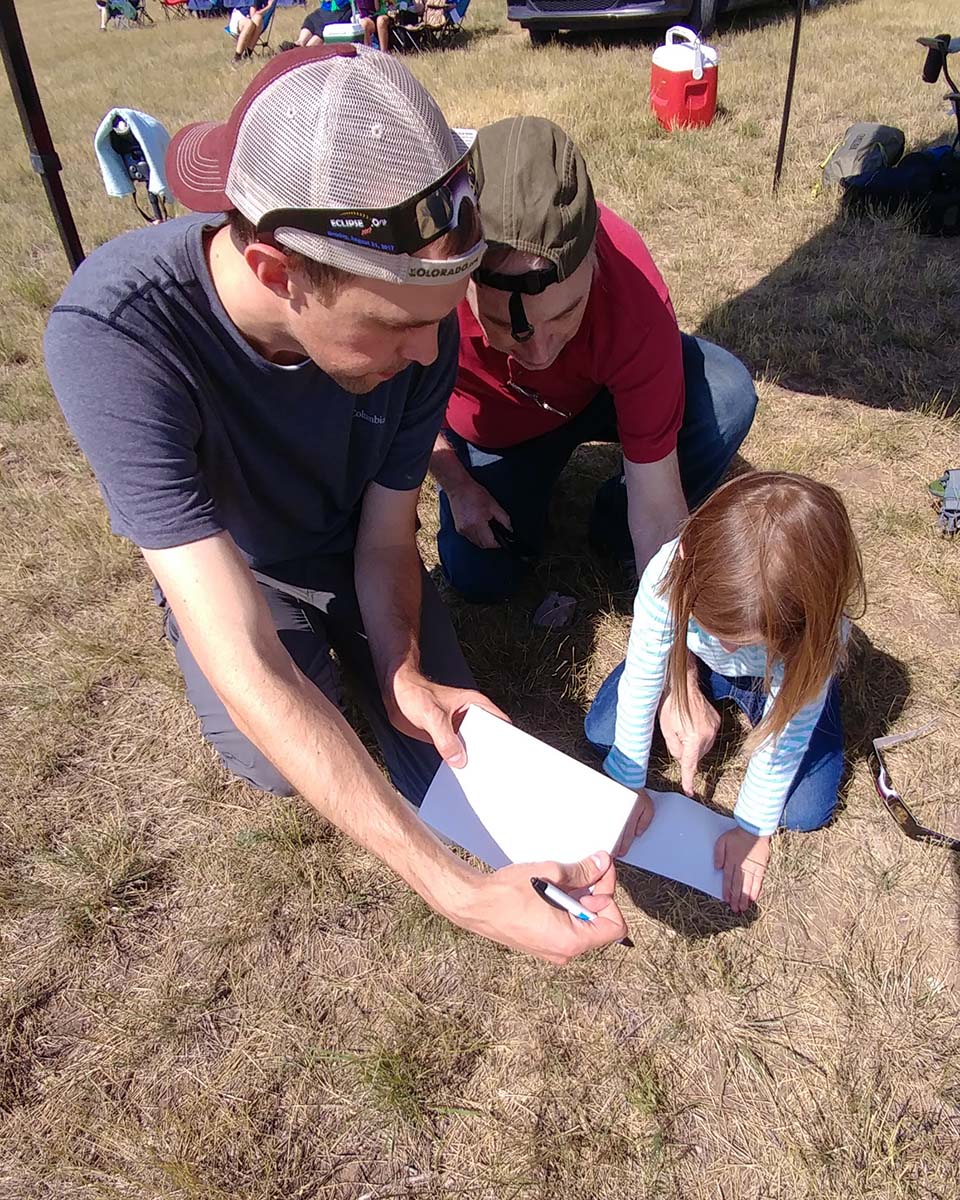 Using a card with a pinhole to project the partially eclipsed sun onto a piece of white paper.
Magnified Observation (Telescopes, Binoculars, and Cameras)
During totality, having a set of binoculars on-hand to view the corona and prominences close-up can be really cool. Just make sure you move them away from your eyes before the sun comes back out, after which point you’ll need to put the filters back on them.
If you’re using a camera or telescope or binoculars to direclty view the eclipse, any time it’s a partial eclipse, you must have a proper solar filter as the first optical element of your setup. In other words, the filter has to be on the front of the lens. If you put it behind the lens or on the eyepiece, you’ll likely melt the filter as well as rapidly burn a literal hole in your retina as the lens concentrates the powerful sunlight to a single point. Even if you use live view on your camera or have a mirrorless camera that shows a video feed rather than providing a direct optical path from the lens to your eye (which is a good practice for protecting your eyesight) you’ll burn through your shutter, scorch your sensor, melt your iris blades, or otherwise damage your camera and/or lens. Also note that a dark regular ND filter may not block the UV and infrared spectra that a proper solar filter would, which could allow invisible but extremely dangerous energy into your eye or equipment.
Logistics
If you’re in a place that’s nicely in the path, count yourself lucky.
If you live in a population center not far from the path, I’d argue it’s worth a trip. But be prepared for crowds. Plan a spot ahead of time. Give yourself plenty of time to get to your target destination on the path. And be ready for massive traffic jams on the way back. The eclipse ends at the same time for everyone. For reference, in 2017 it took over 8 hours to travel from Glendo, WY to Denver, CO after the eclipse - a trip which would normally just take 3 hours. Start the day with a full tank of gas, bring snacks, and set your expectations appropriately. Or perhaps make a plan to camp out somewhere and wait to leave until the next day. Despite being caught in a massive traffic jam with half of Denver trying to get back on I-25, I can say that it was undoubtedly worth dealing with the traffic.
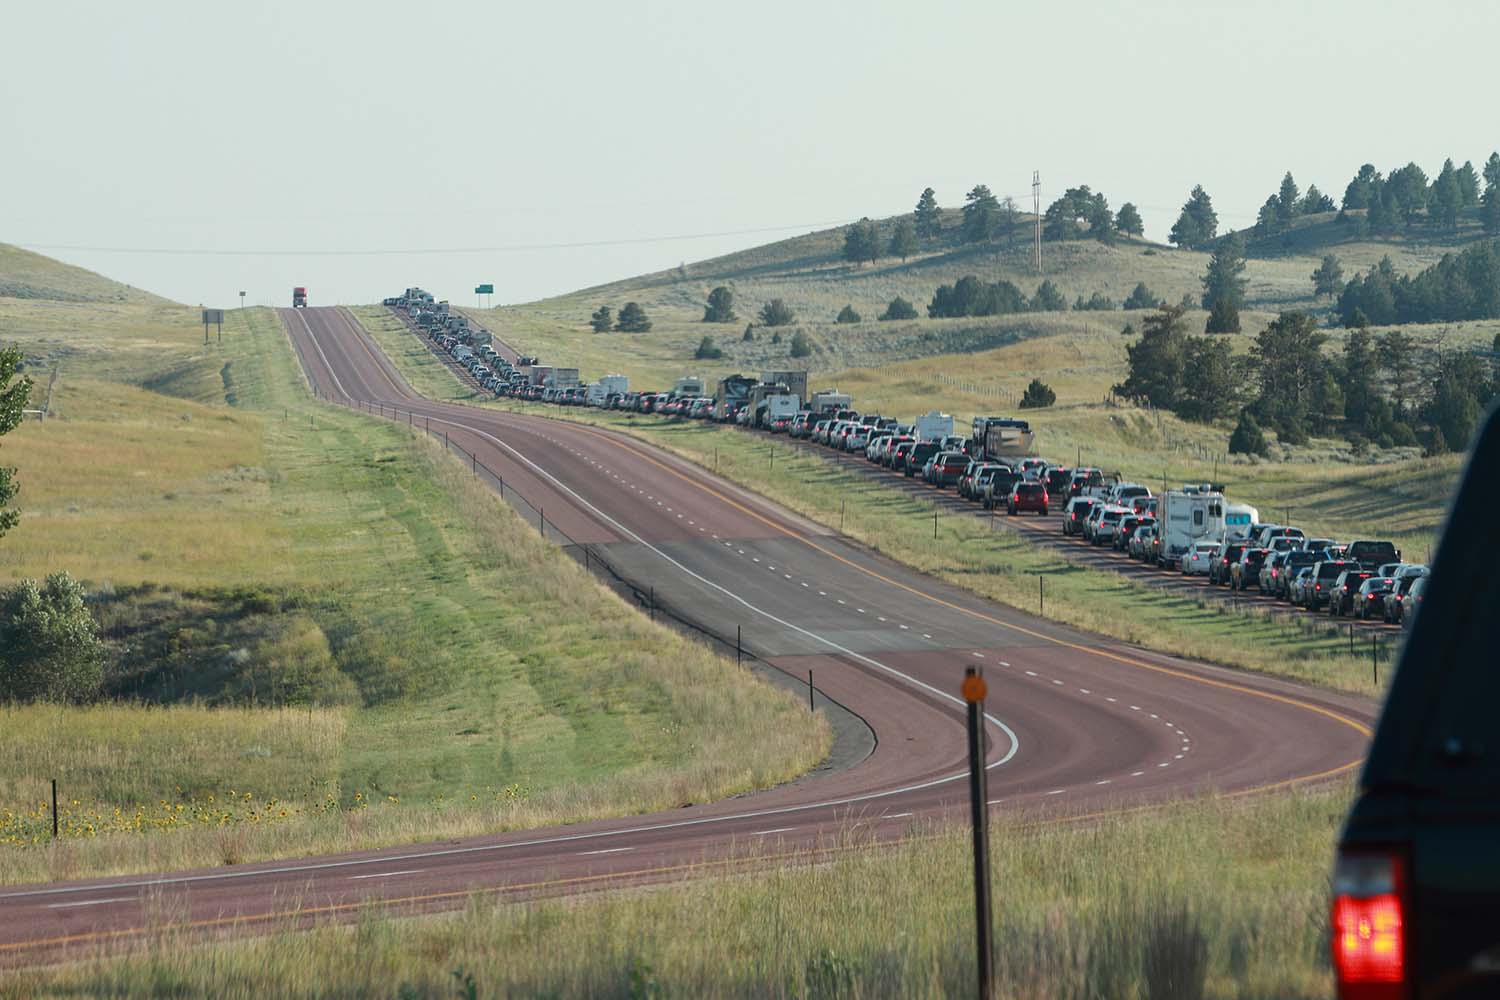 Southbound I-25 from Glendo, WY heading to Denver after the August 21, 2017 eclipse
Think about where people in your vicinity will be traveling. As an example, I expect that major thoroughfares from Houston towards the path will experience traffic like this. I-45 SB from Ennis, TX will likely be gridlocked, as will EB US-290 returning from near Austin and possibly EB I-10 from west of San Antonio. Backroads might not be so bad, but they’re also smaller and not immune to clogging. If you’ve been stuck in hurricane evacuation traffic, that’s probably what you should prepare for. Similarly, in the northeast, I expect that roads from the major metro areas like NY and Boston which are a “day trip” from the path will very likely be clogged with huge numbers of people.
Photography
I’ve got an evolvoing blog post up on my photography website blog about photographing a total eclipse in the coming days. If this is your first time to see a total eclipse, consider whether it’s worth spending time during those precious 3-4 minutes of totality futzing with a camera. My suggestion would be that unless you’re really passionate about the photography thing, it’s best to just enjoy the moment. Total eclipses are very dynamic events, require somewhat specialized equipment to photograph well, and if you make it about photography you stand to miss out on (or dilute) what should be an incredible experience. That said, I didn’t follow this sound advice in 2017 and in retrospect I’m happy with that choice, but I’m also a huge photography nerd who enjoys highly technical challenges and I invested time putting together a plan that automated a lot to let me be very hands-off my photography gear during totality. I think for most people, leaving the camera in the bag or just pulling it out a few seconds to shoot a couple of shots on some auto mode is pretty good advice.
A Deeper Meaning
What I like best about a total eclipse is what it tells us about the universe. The total eclipses we experience are incredibly unlikely. The sun is over 865,000 miles in diameter - more than 3x larger than the distance from the earth to the moon. The moon, by comparison, is just 2,159 miles in diameter - less than 0.25% the diameter of the sun. Then there’s the distance to each of these heavenly bodies. The distance to the sun ranges between 91.4M to 94.5M miles, and to the moon between about 218,000 and 248,000 miles.
It just so happens that these distances mean that the moon (which is much smaller but much closer) is very similar in its apparent size in the sky compared to the sun - sometimes slightly larger, and sometimes slightly smaller. This means that when the moon happens to pass in front of the sun on an occasion when it’s slightly larger in apparent size, its shadow just barely reaches all the way to the earth, tracing a path no wider than about 100 miles across the globe.
Then, there’s the orbit. The moon’s orbital plane is a bit skewed from the sun’s orbital plane. This means that we don’t get an eclipse every month, but instead only a couple of times a year when the orbits line up, and of those, total eclipses only happen about once every 18 months. This also means that eclipse paths tend to be scattered all over the earth - any given location on the earth will experience a total eclipse on average once every ~375 years.
What this all adds up to is that this incredibly unlikely combination of sizes, distances, and orbits give us this very rare and extremely unlikely phenomenon. The kicker, though, is that it also happens to be beautiful. I wasn’t kidding when I said it’s the most incredible natural phenomena I’ve ever beheld. And that’s where the rub for me is. There’s no reason that the moon getting in the way of the sun should be some magnificently beautiful spectacle in and of itself. But it is. And for me, that tells me that the unlikely combination of sizes, distances, and orbits have a purpose and design behind them, to tell us something of the goodness and majesty of the One who created them and put them in place.
For his invisible attributes, that is, his eternal power and divine nature, have been clearly seen since the creation of the world, being understood through what he has made. As a result, people are without excuse.
Romans 1:20 (CSB)
Post Matter
And for those who have gotten this far - back in 2017, I traveled to Glendo, Wyoming to experience the total solar eclipse with my father, my oldest daughter, and a good family friend. We pointed one of our video cameras at ourselves to capture our reaction to this spectacle, which was a new experience for all of us. Here is that video.